Charters and Districts Sharing Space
Since the first charter law was adopted in 1991, charter schools have struggled to find adequate, affordable facilities. Surplus and underutilized district facilities have always seemed a logical answer for charter school facility needs and, in some cases, they provide a valuable option with significant financial benefits to the school.
In coming months, the Charter School Facility Center at the National Alliance for Public Charter Schools and Momentum Strategy & Research will release key findings leading to a final report summarizing the landscape of charter schools in district facilities, and the impact state policy has on that experience.
Background
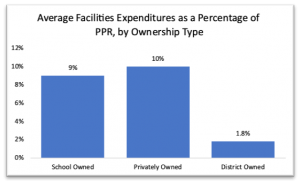
The Charter School Facility Initiative (CSFI) led an extensive survey of charter school facilities across 20 states and 1,960 charter schools between 2008 and 2018. According to an earlier 2013 report CSFI: Initial Findings from Twelve States, charter schools in district owned facilities pay an average of 1.8% of per pupil revenue on their facilities, while charter schools in non-district facilities pay 9% to 10%.
According to data from a follow-up 2015 report Finding Space, summarizing 14 states, 22% of the charter schools surveyed were in district-owned facilities which are relatively concentrated either in states or specific cities. Across the 14 surveyed states, 65% of the charter schools in district facilities are in California and 16% are in New York City. By contrast, the percentage was under 5% for Indiana, Massachusetts, and Michigan combined.
The Finding Space report also found that charter schools in district facilities spent significantly less on facilities than their charter school peers not in district facilities. Translating the numbers from the 2013 and 2015 reports to today’s context:
- Comparing the 1.8% spent by schools in district facilities to the 9% spent by those in non-district facilities would be a difference of $687 per pupil per year, Institute of Education Sciences.
- Translating to a per school difference of $304,511 per year (average enrollment of 443).
Highlighted Issues
This year’s report from the Facility Center will further explore the landscape of charter schools in district facilities by building upon the CSFI data while adding new data sources including a complete compilation of state statutory provisions connected to the first of its kind crowdsourcing effort. The goal is to better understand how the wide variety of statutory provisions function. Crowdsourcing can provide aggregated data capturing the local knowledge and experience with the respective statutes and local environments. The upcoming report will address important questions, including though not limited to:
Costs versus Rent: There’s little argument that charter schools in district facilities should pay their share of facility costs such as utilities and maintenance, but should they pay more than that in “rent”? The data suggests a wide range in what schools pay for when using district facilities, and it is not always consistent with state statutes.
Data from Finding Space shows 13% of the 343 charter schools in district space were paying more than just costs for the use of district space. The median difference when paying costs versus costs plus rent is over $420,000 per school.
Shared Space: While most of the discussion about ‘access to district buildings’ involves empty district facilities, there may be as much or more potential for charter school use of partially occupied facilities.
The majority of charters in district facilities are in previously empty buildings, but California and New York have a significant number of charter schools in shared district facilities. From the CSFI dataset, approximately 41% of charter schools in district buildings share that space and nearly all of those are in California and NY. In both states, strong policies helped open a significant number of partially occupied facilities to charter schools.
Shifting Enrollment: According to NCES (Table 216.90) data, from 2009-10 to 2018-19 overall public school enrollment has increased by 1.25 million students, of which 1.68 million are charter school students, meaning traditional districts have experienced a slow downward trend with a net decrease of 430,500 students during that time.
COVID-19 has exacerbated that trend over the last two years. According to a recent analysis by the National Alliance, “across 42 states in the analysis, charter schools gained nearly 240,000 students (a 7% increase from 2019-20 to 2020-21), while other public schools, including district-run schools, lost more than 1.4 million students (a 3.3% loss from 2019-20 to 2020-21).”
The number of schools shows a similar trend: From 2009-10 to 2018-19, traditional district schools decreased by 2,537 while charter schools increased by 2,475. As these trends continue, there will inevitably be greater available district space and a larger charter school demand for that space.
These issues and others will be in the forthcoming report further exploring the landscape of charter schools in district facilities and how state and local policies impact access. As the research is ongoing, please be sure to contribute your knowledge through the crowdsourcing effort. You may sign up to participate here.